Thursday, 28 February 2013

Week 4:


After two days of the office time, the more complex part: the connection of the three phase AC circuit, was completed. However, there is a complex problem exist in the DC transfer to three phase AC bridge. If a DC voltage need to be transferred to a AC voltage output, the bridge need a generator to generate a square wave in a certain frequency, but the best frequency of the generator is hard to determined. With the supervisor’s help, we find the best generator frequency and all the components were successfully connected in the circuit by following the figures provided in the lab script. The universal bridge section was made of 6 MOSFET transistor and 6 diode and the best frequency is set to 1080 HZ.

In this week, the whole photovoltaic array simulation model for Matlab-Simulink was successfully completed. However, during the process of getting the results of PV cell, there were some problems with the figure. The graph is appearing slowly in the scope, the  curve can not be completely shown in the scope.

In the office time, out supervisor tell us to change the solver section in the simulation configure, and the problem was solved. The following graph shows the complete block diagram of this project:


the complete photovoltaic array circuit


As our group complete this project, the result can be release as follows. 


the result of part1


Result(Part 1):

According to the figure, the current through the PV unit is Ic, the voltage output of PV array is Vpv, and the power output of the PV array is Ppv. As shown in the Ic - Vpv figure, the Ic decrease as the voltage Vpv increase because the Ic and Vpv has a relationship of Vc = (A * k * T) / e * ln((Iph + I0 - Ic) / I0) - Rs * Ic. And the Ppv has a maximum value when the voltage output is 16V because ISC = ID−VD / Rp −IPV. Ppv = ISC * ((A * k * T) / e * ln((Iph + I0 - Ic) / I0) - Rs * Ic). As a result, the Ppv has a maximum output 70 when Vpv = 16.


the result of part 2 (the inverter voltage)


the result of part2 (the one phase load voltage)


Result(Part 2):
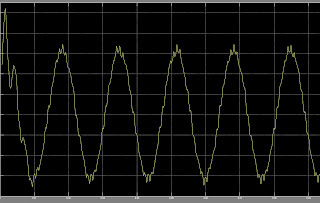
The output voltage of the inverter is shown in the  left figure. It was formed by several small square waves. The small square waves are generated by the pulse generator, and the value of the square wave is controlled by the bridge. When the output line voltage is positive, the square waves switch to positive, when the output line voltage is negative, the square wave switch to the negative. After the process of LC circuit, the DC input voltage will be changed into sin AC voltage as a output. 
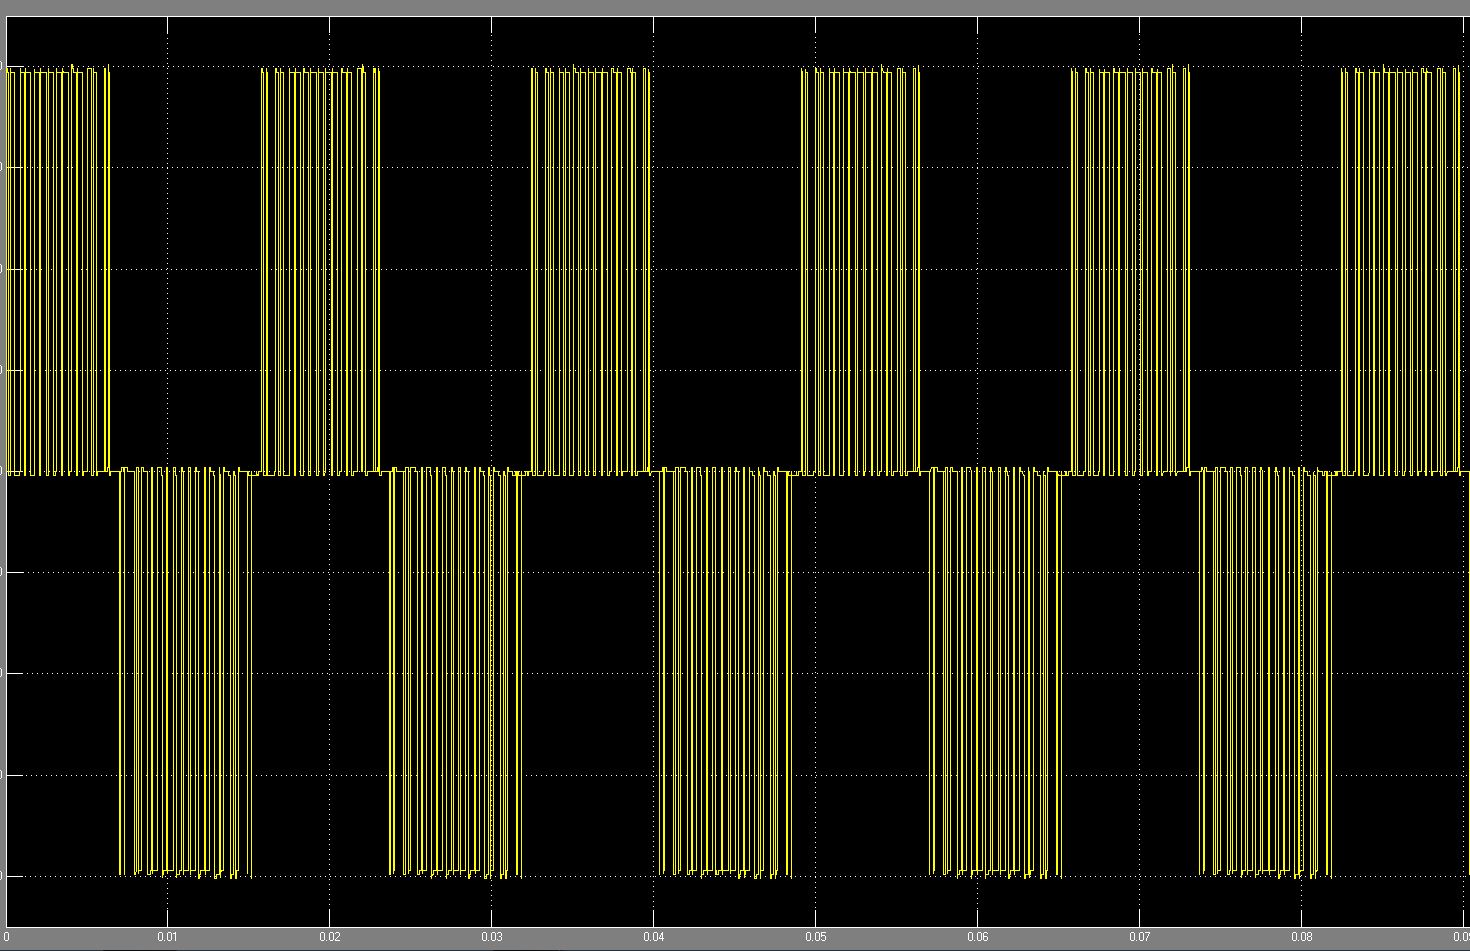


Thursday, 21 February 2013

Week 3:


In this week, we improve some of the object last week, that is changing the block diagram in temperature and solar irradiation calculation into system function. The reason is that the formula in the temperature and solar irradiation system contains a lot of variables and the calculation is complex. The block diagram will look very crowded and  disordered if it is applied. However, the system function is using Matlab language to express the formula, it looks clearer and more simple. The following graph is showing the system function of the temperature and solar irradiation formula:


system function of temperature & solar irradiation


When the PV cell and the temperature & solar irradiation part was successfully completed. The combination of all the subsystems and connecting the circuit with the controlled voltage source, the controlled voltage source will generate DC voltage which has the same amplitude of the the input number calculated by the PV cell part. As a result, a DC voltage supply of photovoltaic is created. Moreover, the results I - V graph and P - V graph were similar to the results provided by the materials. During the office time, the supervisor ordered the group to do some more research about AC voltage supply with the PV cell and the three phase transformer need to be connected into the circuit in the end. The following graph shows the block diagram of the DC photovoltaic array circuit.


the DC circuit part


Wednesday, 13 February 2013

Week 2:


The whole structure of the voltage generator part:


structure of the voltage generator


Our group began doing the first part of the subsystem, the output voltage of PV cell by using the Matlab Simulink. It was quit easy for the group to finished building the first part of the subsystem after mastering some of the skills of Simulink by reading the materials of system functions and Simulink. In this material, it shows how the Simulink worked and how the is the connection of each small system. And also, it has a brief introduction of how to program basic system function, which will used in the experiment for some complex formula. In addition, all the steps were followed in the lab script which the supervisor provided for the group. In this script, the figures of some of the subsystem were provided which helped the group know the theory of the subsystem. The following graph is the theory of the PV cell unit model:


PV cell system


Because the first part of the subsystem was finished quicker than the plan, the group continued to the second part of the subsystem. Which was the temperature and solar irradiation effect of the output system. The output voltage of the PV cell will be affected by the solar irradiation level Sc and the operating temperature Tc. The formula which represent the output voltage affect by the Sc and Tc is VPV =  CTV * CSV * Vc and Iphx = ITV * ISV * Iph.  In this weeks office time, the subsystems were shown to the teachers and the only question was about the differences of dot plus and x plus. The following graph shows the Simulink Modeling of the PV unit cell and temperature & solar irradiation part.


temperature & solar irradiation


Wednesday, 6 February 2013

Background:


This project is doing research for photovoltaic array simulation model for matlab-simulink GUI environment. The new efficient photovoltaic solar cells (PVSCs) can be used in renewable green power, energy conservation and demand-side management. However, photovoltaic solar cells are not cheaper enough comparing with the utility grid because the existing utility fossil fuel generated electricity so it are not widely using in nowadays. The solar array system needs special design considerations due to varying nature of the solar power generated resulting from unpredictable and sudden changes in weather conditions. The model is invented by using basic circuit equations of the photovoltaic solar cells which including the effects of solar irradiation and temperature changes. The model was tested by using a dc load and controlled voltage source


Giant Photovoltaic Array


The PV cell unit system